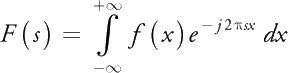
Definition of the Fourier Transformation
WWW.SIGNALANALYZER.DE - Analyze your Measurement Technology in a simple way...
The program allows you to read, process and display continuous discrete-time signals in the time domain and frequency domain. The program features an FFT algorithm (Fast Fourier Transform, radix-2 algorithm) for a fast time-to-frequency conversion (it does not support frequency-time conversion). The FFT is comparable to the more general DFT (Discrete Fourier Transform), but the FFT is much faster in terms of computational speed.
Because of the simple file format, importing from other tools, spreadsheets or custom applications is very simple. In this way, raw data from analog to digital converters are used for the characterization of an amplifier or a complete measurement chain, but also for a theoretical analysis of synthetically generated values. In addition to loading the values, the sampling rate must also be selected in the program options. A recording of measurement data is not supported, but the program can be easily integrated into other applications. In addition, the software provides a change detection of the source file to automatically update the display. This feature can be used for a moving display of measured values. In addition, the software offers the possibility of displaying a histogram and an automatic check for rectangular or normal distribution.
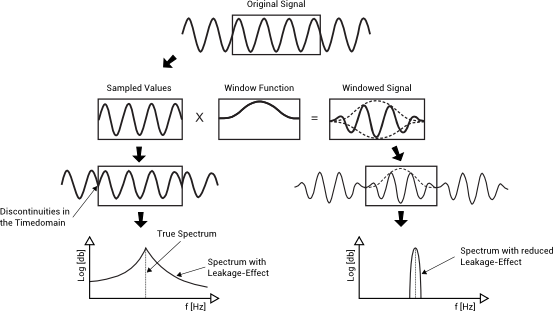
A wide range of manipulation of the data allows a deeper look at the data. To the manipulation of the data there are a large number of typical window functions to minimize the leakage effect. In the time domain all values are weighted with a specific function. Another manipulation of the data is the filling of zeros to the next higher powers of two. This achieves a finer spectral resolution. The number of measured values is no longer limited to a two potency. A further data manipulation is the interval function. This realizes a variable averaging in the frequency domain. It minimizes uncorrelated signals (eg noise) and highlighted systematic interference from the noise band. Statistical data such as minimum, maximum, peak-peak, average, rms, rectified value, crest factor, form factor, noise and drift can be calculated. An automatic check of the distribution is also carried out (normal or uniform distribution). To filter out interferences a variable powerful digital filter is available. This can be freely parameterized and are implemented as a FIR filter. A highpass, lowpass, bandpass and bandstop filter with different slopes can be realized. A low-pass filter can reduce the noise by limiting the bandwidth, with a band-stop filter you can filter out 50Hz or 60Hz interferences. The calculated FIR filter coefficients can be exported to use in your own applications.
The program is very easy to use and requires no training. Some sample files and a detailed help contribute to this. The intuitive graphical user interface includes the most important functions directly. The chart provides mouse with scroll wheel support. With multiple zoom option, individual components are considered in detail. For each data point, the corresponding values are displayed when moving the mouse. With a range of options, the graph will be influenced by the user. The time range is user-scaled and the frequency range is shown in the usual decibel scale. However, the amplitude in the frequency domain can also be represented linearly as an effective value or as a noise density. The maximum spectral amplitude can be automatically set to 0dB or set manually. The maximum spectral amplitude can be automatically set to 0dB or set manually. Results can be stored for documentation in various formats or printed directly. All values shown can be exported in tabular form or as a graph.
All these functions can be used for spectral analysis by engineers, scientists, students, professionals and serious amateurs in digital signal processing. A basic understanding in the field of digital signal processing is advantageous. The freeware is limited only in the number of values, but not in features.